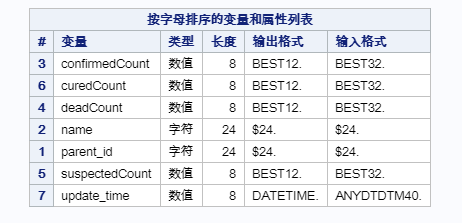
data sasr_all_data; set work.import; datetime = datepart(update_time); hour = hour(update_time); format datetime yymmddn8.; drop suspectedCount update_time; run;
data hubei_data; set work.sasr_all_data; where datetime between input('2020-01-29',yymmdd10.) andinput('2020-02-20',yymmdd10.) and hour = 20 and name = '湖北省'; drop parent_id; run;
data all_data; set work.sasr_all_data; where datetime between input('2020-01-29',yymmdd10.) andinput('2020-02-20',yymmdd10.) and hour = 20 and parent_id = 'NULL'; drop parent_id; run;
数据计算
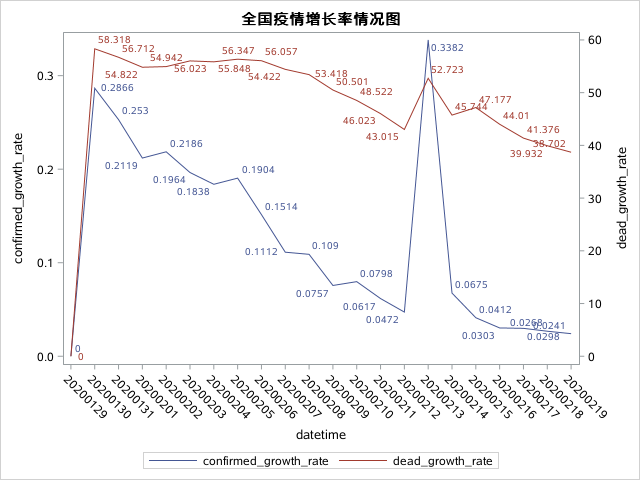
将数据按照日期汇总,计算出全国总的确诊人数、死亡人数、治愈人数:
1
2
3
4
5
6
7
8
proc sql; createtable all_data_sum as select t.datetime, sum(t.confirmedCount) as confirmedCount, sum(t.deadCount) as deadCount, sum(t.curedCount) as curedCount from all_data t groupby t.datetime; quit;
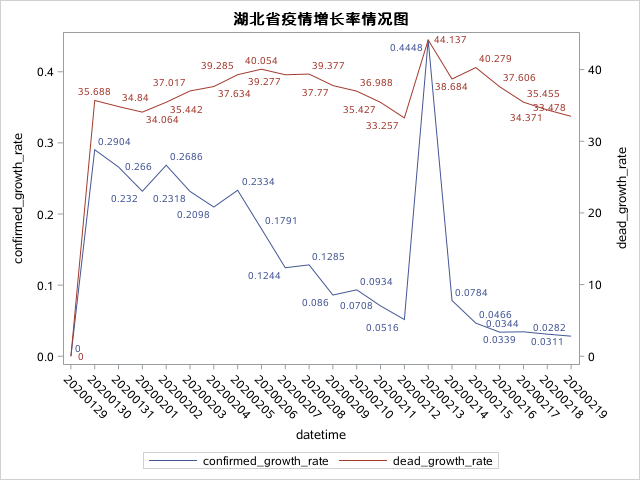
计算增长率,计算逻辑与之前相似:
1 2 3 4 5 6 7 8 9 10 11 12 13
data all_data_handle; set all_data_sum; retain confirmed_temp cured_temp dead_temp; confirmed_growth_rate = abs(confirmed_temp - confirmedCount) / confirmed_temp; cured_growth_rate = abs(cured_temp - confirmedCount) / cured_temp; dead_growth_rate = abs(dead_temp - confirmedCount) / dead_temp; confirmed_temp = confirmedCount; cured_temp = curedCount; dead_temp = deadCount; if confirmed_growth_rate = . then confirmed_growth_rate = 0; if cured_growth_rate = . then cured_growth_rate = 0; if dead_growth_rate = . then dead_growth_rate = 0; run;
图形可视化分析
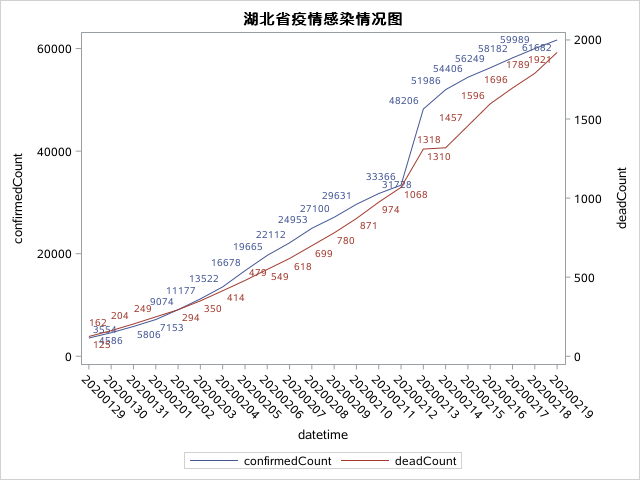
首先看一下全国的每日死亡人数和确诊人数:
1
2
3
4
5
6
7
8
title"全国疫情详情统计图"; proc sgplot data=all_data_handle; xaxis type=discrete; series x=datetime y=confirmedCount / datalabel; series x=datetime y=deadCount / datalabel y2axis; run; title;


 wechat
 alipay